DWD color maps#
pyku is the reference implementation of the DWD colormaps: DWD default color maps
Import library#
Load the DWD colormap module.
In [1]: import pyku.colormaps as colormaps
Also import matplotlib, numpy and xarray for the examples
In [2]: import numpy as np
   ...: import xarray as xr
   ...: import matplotlib.pyplot as plt
   ...: import pyku
   ...:
Get names of all colormaps#
To get the names of all available colormaps:
In [3]: colormaps.get_colormaps_names()
Out[3]:
['temp_abs',
 'temp_ano',
 'temp_anp_abs',
 'temp_anp_ano',
 'temp_nnp',
 'temp_nnp_cat',
 'precip_abs',
 'precip_ano',
 'precip_anp_abs',
 'precip_anp_ano',
 'precipKV_ano',
 'precipKV_nnp',
 'precipKV_nnp_cat',
 'sun_abs',
 'sun_ano',
 'sun_anp_abs',
 'sun_anp_ano',
 'sun_nnp_cat',
 'radg_abs',
 'radg_ano',
 'dayscold_abs',
 'dayscold_ano',
 'dayscold_nnp',
 'dayscold_nnp_cat',
 'dayscold_ice_anp_abs',
 'dayscold_ice_anp_ano',
 'dayscold_frost_anp_abs',
 'dayscold_frost_anp_ano',
 'dayswarm_abs',
 'dayswarm_ano',
 'dayswarm_nnp',
 'dayswarm_nnp_cat',
 'dayswarm_summer_anp_abs',
 'dayswarm_summer_anp_ano',
 'dayswarm_hot_anp_abs',
 'dayswarm_hot_anp_ano',
 'dayswarm_tropical_anp_abs',
 'dayswarm_tropical_anp_ano',
 'pressure_abs',
 'pressure_ano',
 'relhum_abs',
 'relhum_ano',
 'HZ_abs',
 'HZ_ano',
 'WHZ_abs',
 'WHZ_ano',
 'KV_skill',
 'snow_abs',
 'snow_ano',
 'wind_ano',
 'wind_abs']
Get a colormap#
We can then get a colormap like so
In [4]: colormaps.get_cmap(
   ...:     'temp_ano',
   ...:     kind='segmented',
   ...:     nbins=10,
   ...:  )
   ...:
Out[4]: <matplotlib.colors.ListedColormap at 0x7f0bac497050>
Get colormap colors#
The colors can be obtained in RGB or HEX format like so:
In [5]: colormaps.get_cmap_colors(
   ...:     'temp_ano',
   ...:     kind='segmented',
   ...:     nbins=10,
   ...:     encoding='hex'
   ...: )
   ...:
Out[5]:
['#053061',
 '#2d6390',
 '#5595be',
 '#8ebbd6',
 '#cbdbe4',
 '#e7d1cd',
 '#e09f94',
 '#cd6a60',
 '#9a3540',
 '#67001f']
In [6]: colormaps.get_cmap_colors(
   ...:     'temp_ano',
   ...:     kind='original',
   ...:     encoding='rgb'
   ...: )
   ...:
Out[6]:
[(0.0196078431372549, 0.18823529411764706, 0.3803921568627451),
 (0.3764705882352941, 0.6392156862745098, 0.796078431372549),
 (0.9215686274509803, 0.9215686274509803, 0.9215686274509803),
 (0.8588235294117647, 0.4745098039215686, 0.4117647058823529),
 (0.403921568627451, 0.0, 0.12156862745098039)]
Note
It is not possible to get a list of colors for the continuous colormaps, well, because it is continuous.
All colormaps#
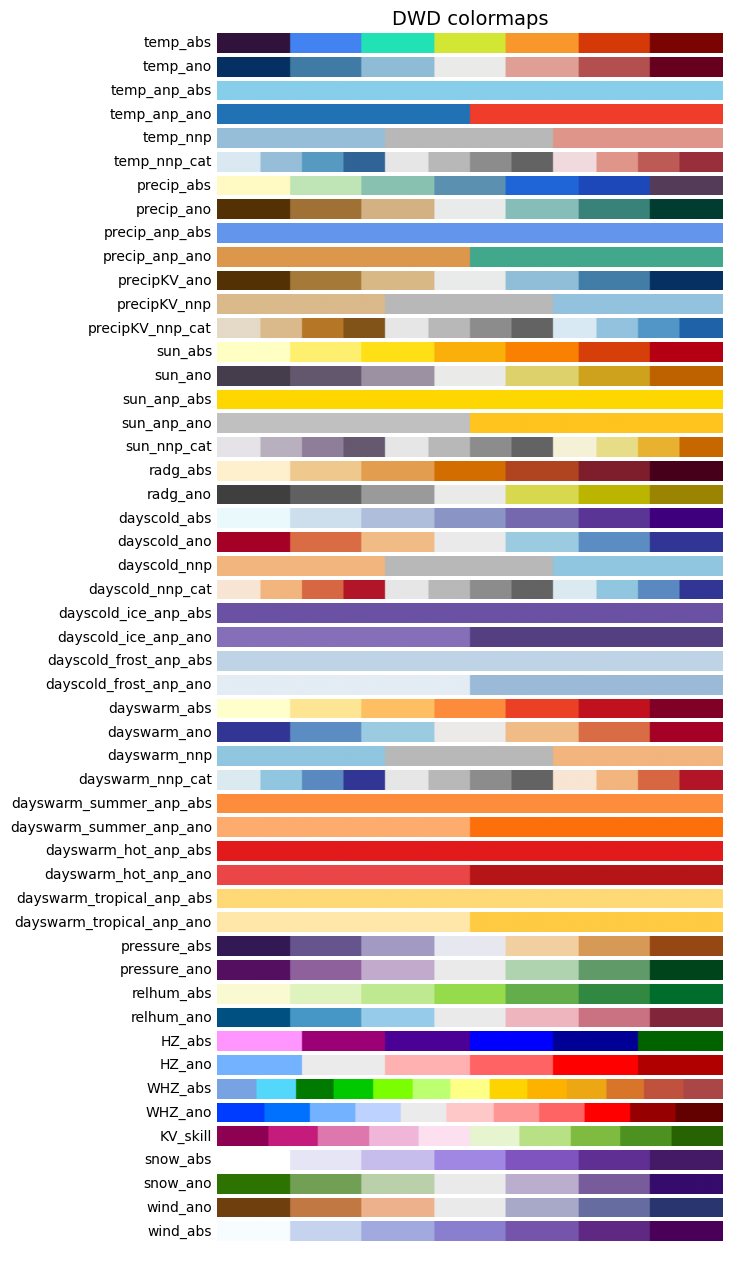
Linear colormaps#
In [7]: colormaps.plot_colormaps(kind='linear')
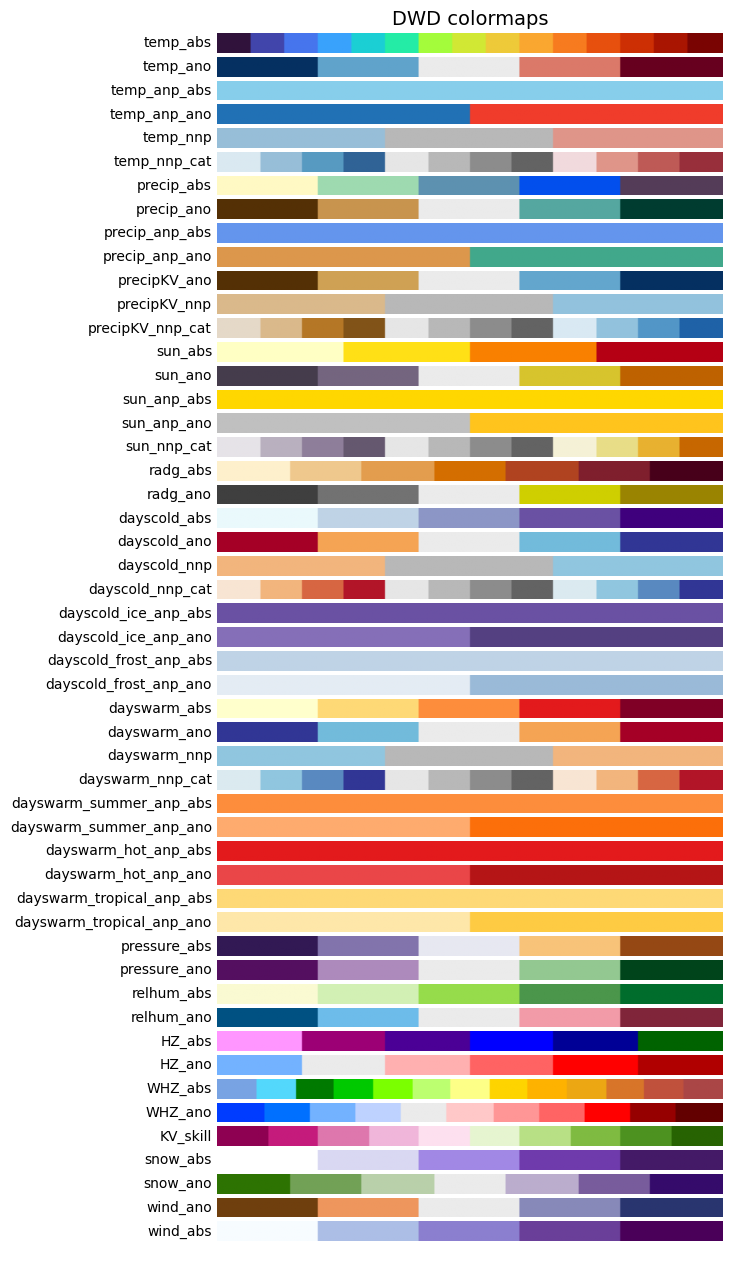
Original colormaps#
In [8]: colormaps.plot_colormaps(kind='original')
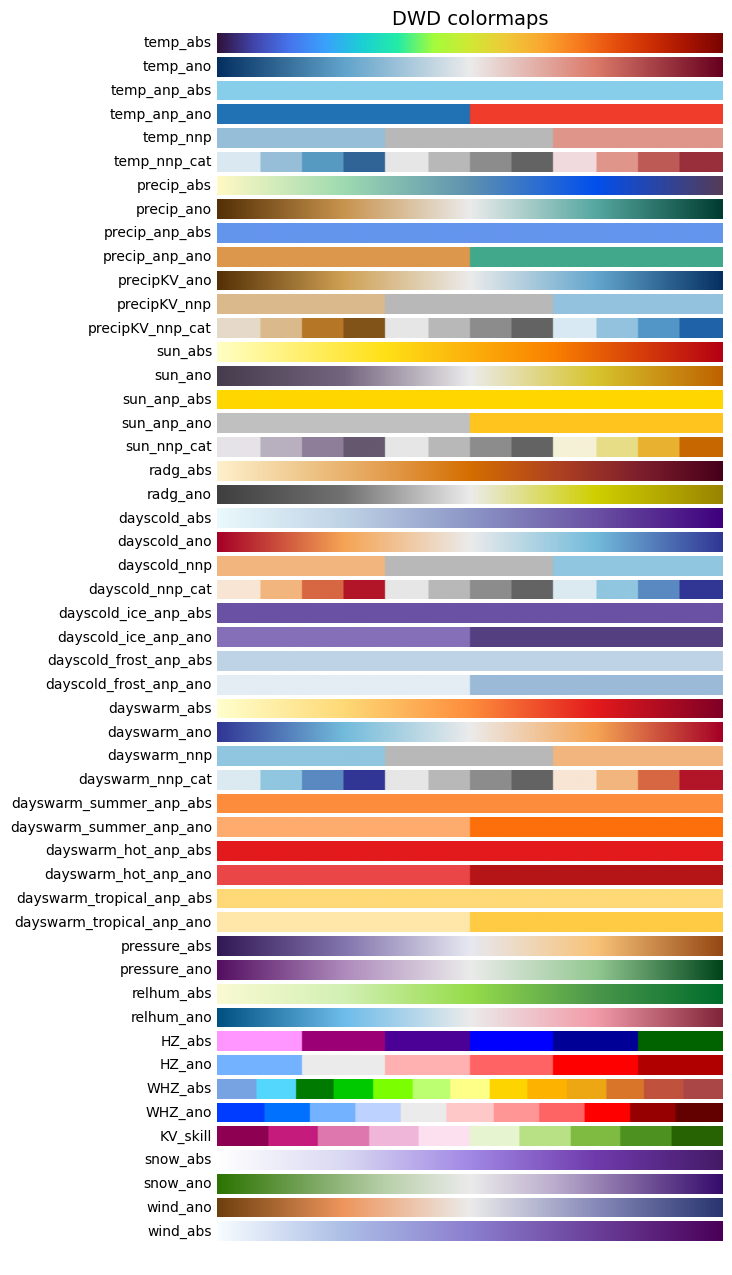
Segmented colormaps#
In [9]: colormaps.plot_colormaps(kind='segmented', nbins=7)
Example usage#
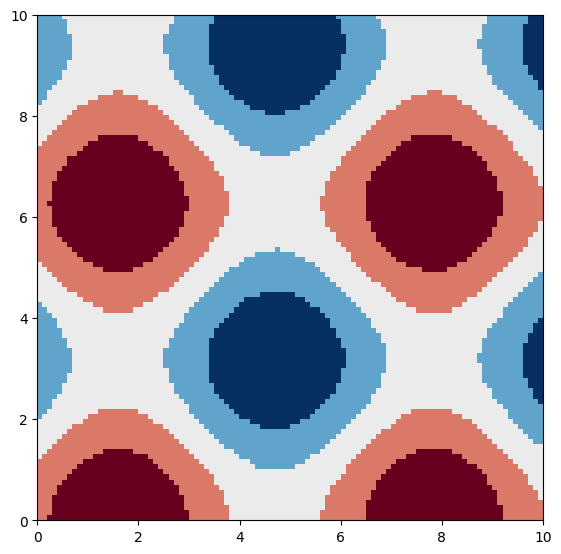
matplotlib#
In [10]: # Clear previous plot
   ....: # -------------------
   ....:
   ....: plt.clf() # Clear previous plot
   ....:
   ....: # Create a mesh grid
   ....: # ------------------
   ....:
   ....: X, Y = np.meshgrid(
   ....:     np.linspace(0,10,100),
   ....:     np.linspace(0,10,100),
   ....: )
   ....:
   ....: # Calculate sinusoid and plot
   ....: # ---------------------------
   ....:
   ....: plt.imshow(
   ....:     np.sin(X) + np.cos(Y),
   ....:     cmap=colormaps.get_cmap('temp_ano'),
   ....:     extent=[0, 10, 0, 10],
   ....:     origin='lower'
   ....: )
   ....:
Out[10]: <matplotlib.image.AxesImage at 0x7f0c02146a80>
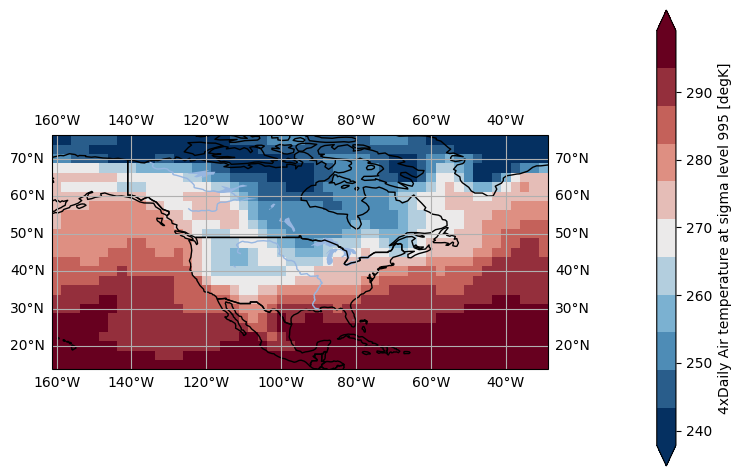
xarray#
In [11]: # Load xarray test dataset
   ....: # ------------------------
   ....:
   ....: airtemps = xr.tutorial.open_dataset("air_temperature")
   ....:
   ....: # Plot
   ....: # ----
   ....:
   ....: airtemps.isel(time=0)['air'].plot(
   ....:     cmap=colormaps.get_cmap('temp_ano', kind='original')
   ....: )
   ....:
Out[11]: <matplotlib.collections.QuadMesh at 0x7f0ba26140e0>
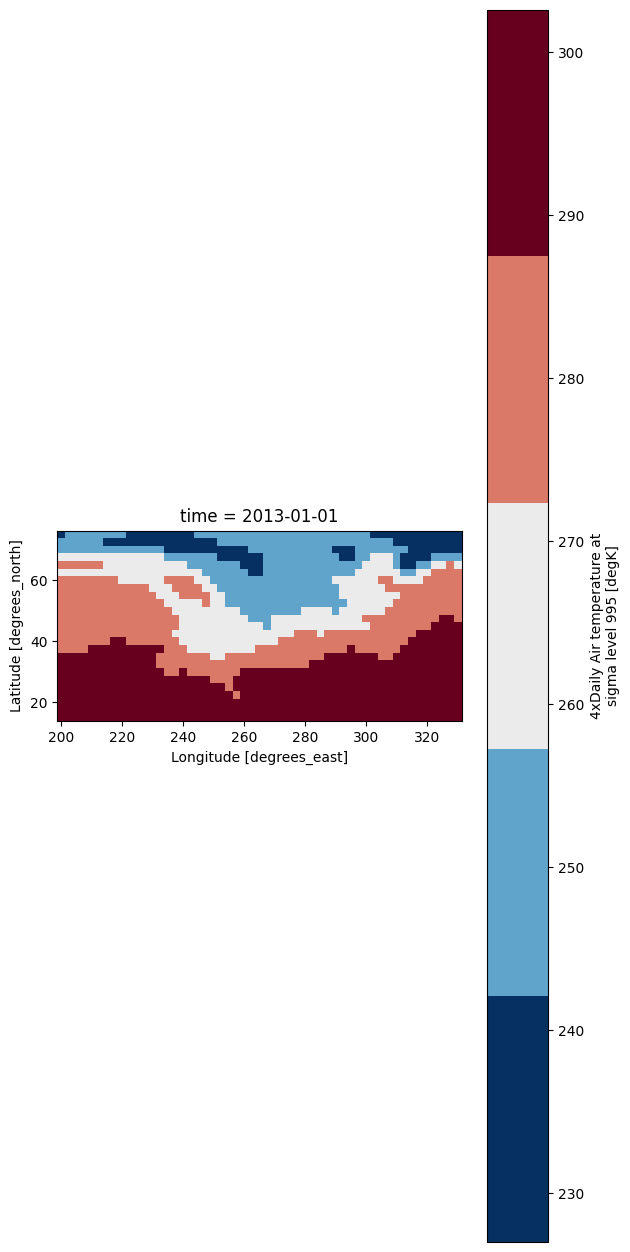
pyku.analyse#
In [12]: # Load xarray test dataset
   ....: # ------------------------
   ....:
   ....: airtemps = xr.tutorial.open_dataset("air_temperature")
   ....:
   ....: # Plot
   ....: # ----
   ....:
   ....: airtemps.isel(time=0).ana.one_map(
   ....:     var='air',
   ....:     cmap=colormaps.get_cmap('temp_ano', kind='segmented', nbins=11)
   ....: )
   ....: